

The Supply Demand report shows the distribution of listings and average weekly sales volume by price, using top ranking listings created within the last 18 months. Filter by seller, brand, category, keywords, price range and region.
The report:
- Shows potential supply gap opportunities with proven sales
- Highlights listings that are excelling at different price points
- Reveals at what price points buyers are purchasing.
Run a report
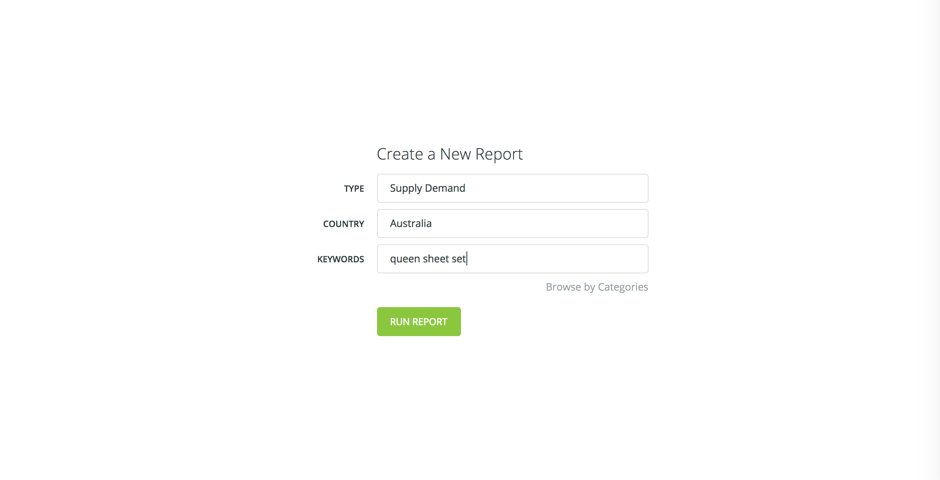
The below example is for “queen sheet sets”.
Create a report by selecting Supply Demand in the report type drop down.
Enter keywords and/or browse by category, located just below the keyword field.
Then Run Report.
Working with the data
The resulting data is presented in a table by default in the Listings view. However, a better starting point is the Chart view. If you can’t see the whole graph, click the Hide Headers button.
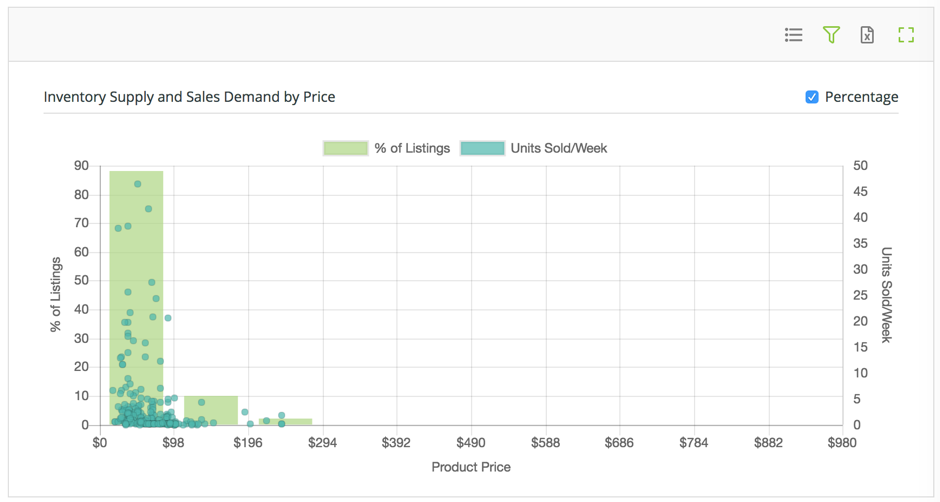
The green bars show the percent of listings in each price range. The dots show the individual listings’ average weekly sales volume at that price.
If the listings are condensed into a small number of price ranges, as in the example above, use the price filter located on the left.
Use the filters to zoom into the data. The graph below has been filtered on:
- Price, using a maximum of $150
- Category, selecting the dominant “Sheets” category
- Condition, “New”.

Example Insights
The graph shows that 25% of listings are in the $30-$45 range with many listings achieving sales. The two listings achieving the highest sales are in the higher price brackets where there is less competition.
Users with a Premium membership can click on the dots to reveal the seller and listing details to see what these high selling listings are doing differently to the rest. It may be that their products have certain features that others don’t, are presented in a different way, or are branded.
Clicking through to the highest performing listings, or sorting the dataset by #sold/wk, reveals very different product features and bundling strategies:
$31-$45: Listing is for a Satin 4PC set
$46-$60: Listing is for a wrinkle resistant microfiber 3PC set (no flat sheet)
$61-$75: Listing is for an Egyptian cotton 4PC set.

There are many different products being offered in each price bracket, but the data shows that this is what buyers are buying.
Further investigation might include:
- Filtering the keywords on satin or microfiber to better understand how sensitive to price buyers are for those specific product types and to see how competitive each price bracket is.
- Looking at how they present their listings and keywords used, as compared to other listings in the same price bracket.
Knowing the market and buyer activity enables you to identify opportunities and optimise your pricing and product range.
Try ShelfTrend free and upgrade anytime when you need more.
No lock-in contracts. Cancel anytime.
The data is very telling and just what you need to grow your business.